XInfinit

Xinfinit Chart

Explore Market Insights: Feature-Rich Financial Widgets with Versatile Tools, Indicators, and Chart Types – Seamless Integration for Any Financial Application.

Why Our Charts?

Unlock Superior Trading Insights with Our Advanced, Customizable Charts.

Integrate Various Data Sources

Easily integrate various data sources with our flexible platform, allowing for the seamless connection and visualization of different data streams.

High-Performance Charts

Our charts deliver peak performance, effortlessly handling extensive data sets, complex drawings, and numerous indicators.

Real-Time Updates

Stay ahead with live market data, as our charts update instantly, ensuring you always have access to the latest market information in real-time.

Branding Neutral

Maintain your brand’s integrity; our widgets blend seamlessly with your platform, free from external branding or links.

Adaptive Design

XINFINIT Charts are designed to adapt to any device, ensuring a seamless user experience across desktop, tablet, and mobile interfaces.

Open Technology

Full control over UI customization with open access to the source code; edit or augment as you see fit.

Swift Deployment

Deploy our charts into live environments within a short period of time, thanks to our straight forward integration process.

Expert Developer Support

Beyond robust documentation and support, our expert developers are at your service to ensure seamless chart integration.

Our Key Features

Discover the Essential Features That Define Our Exceptional Charts

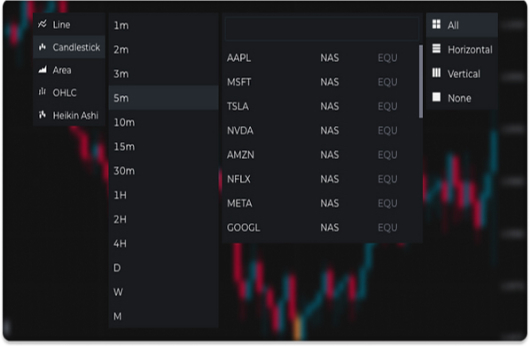
Flexible Chart Arrangement

Tailor your chart's layout to your preferences. Align them by various parameters like instrument, chart type, timeframe, and visual studies for synchronized analysis.
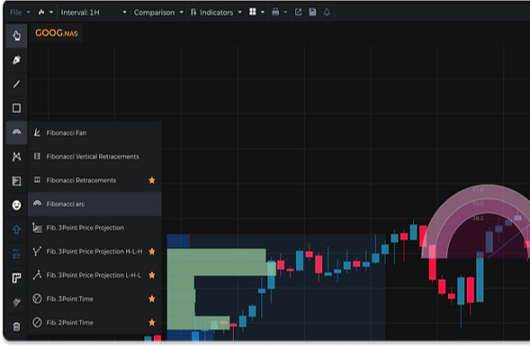
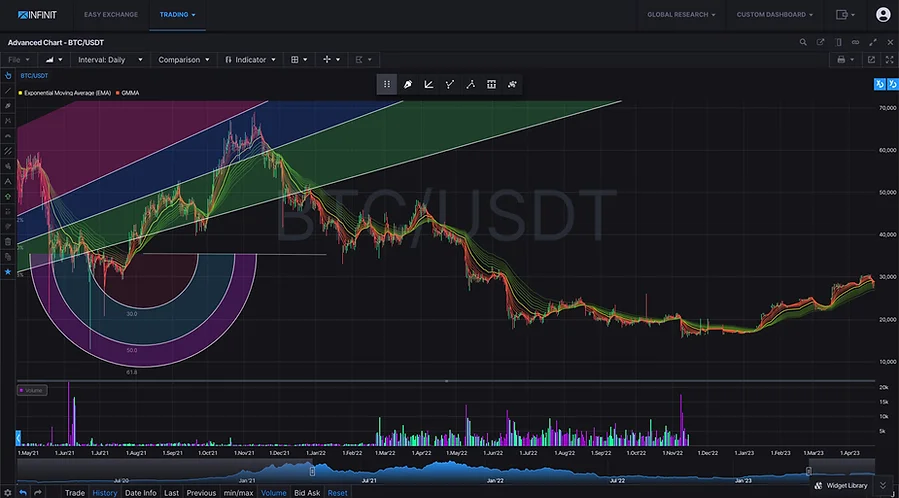
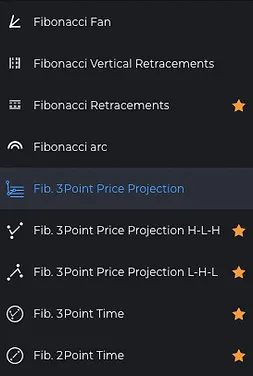
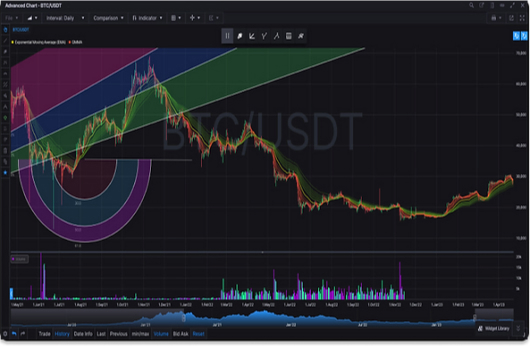
Drawing Tools

Employ over 40 recognized drawing tools for meticulous technical analysis, enabling you to illustrate every notable price pattern.

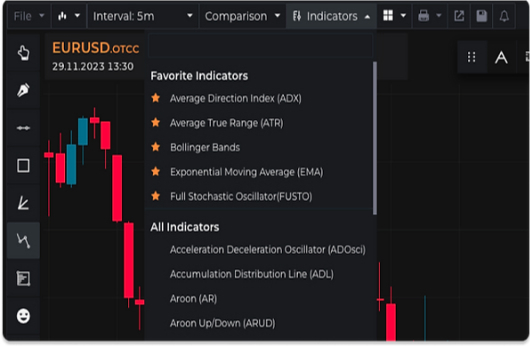
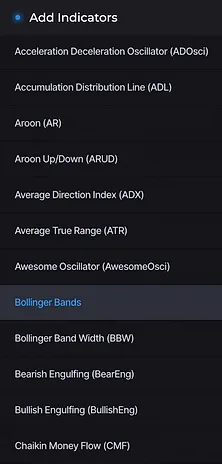
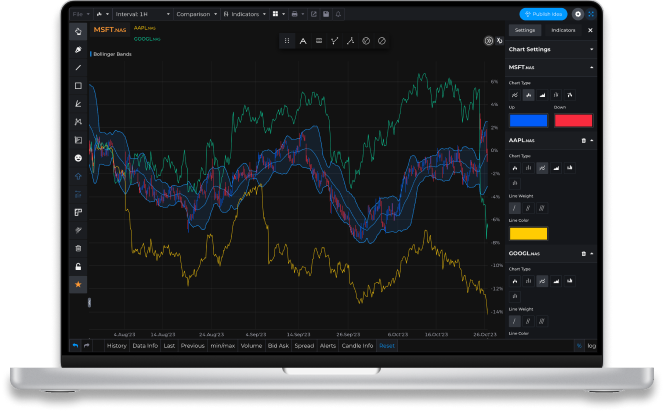
Robust Indicator Library

Explore financial instruments with an extensive selection of indicators. Forecast upcoming trends with our expansive indicator library, which also offers the flexibility to craft tailored chart analysis.
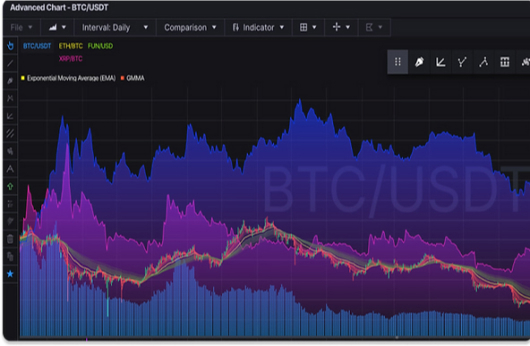
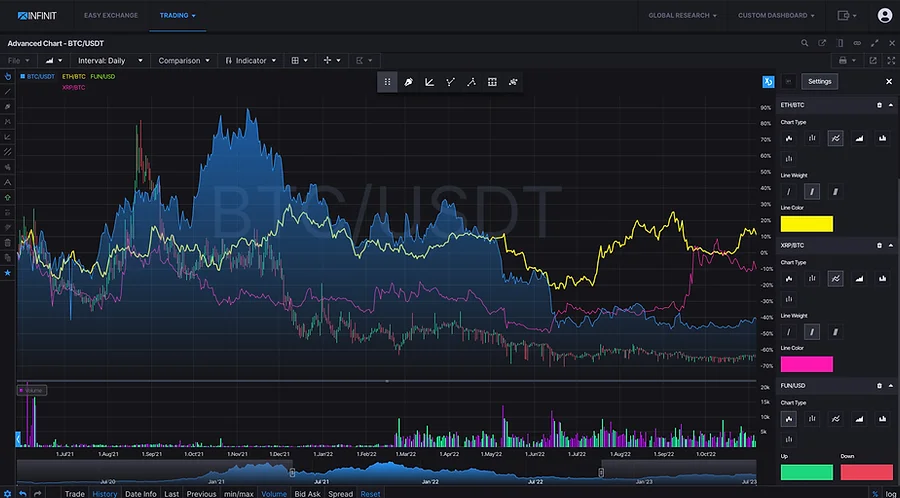
Instrument Analysis

Conduct thorough market analysis with the ability to compare multiple instruments within the same chart.

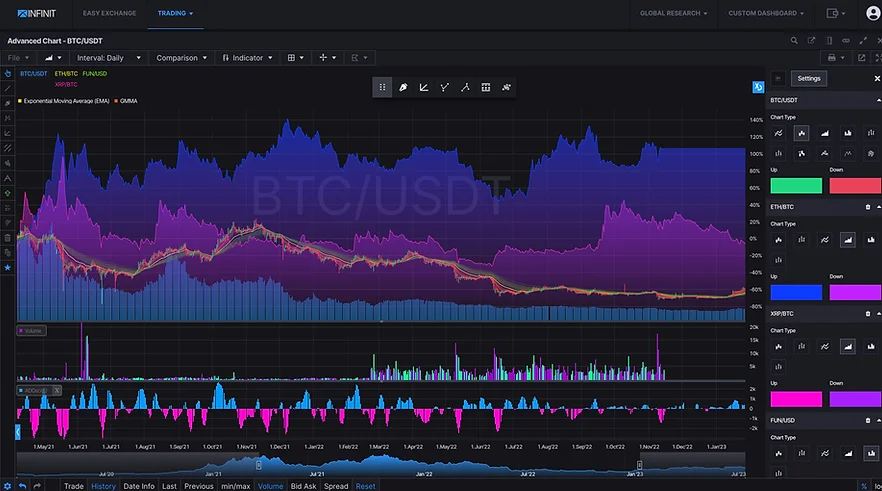
Variety of Chart Options

Utilize a selection of the most widely-used chart types to better interpret market data.

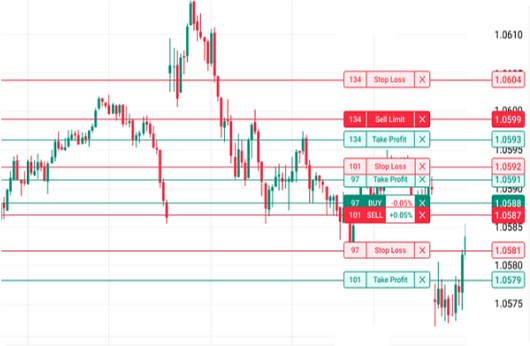
Integrated Order Management

Interact with orders and positions effortlessly through our charts.

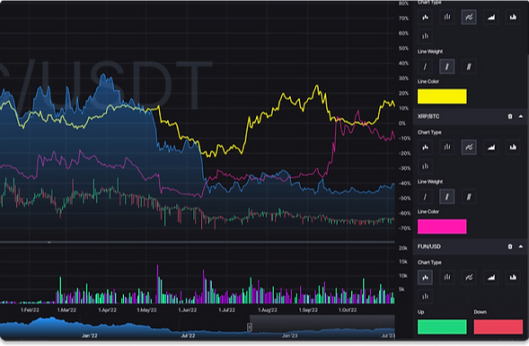
Customizable Chart Visualization Tools

Craft your charts precisely according to your preferences using intuitive settings. These allow you to modify the colors of candles and drawing tools, offering an expanded range of personalization options for analyzing and viewing your data.

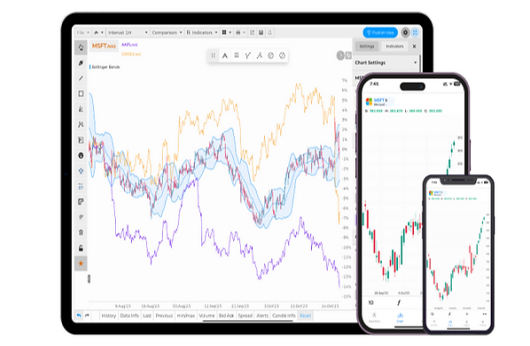
Mobile-Responsive Chart Customization

Designed with mobile responsiveness in mind: Our charts are crafted to ensure a seamless and responsive experience on mobile devices.