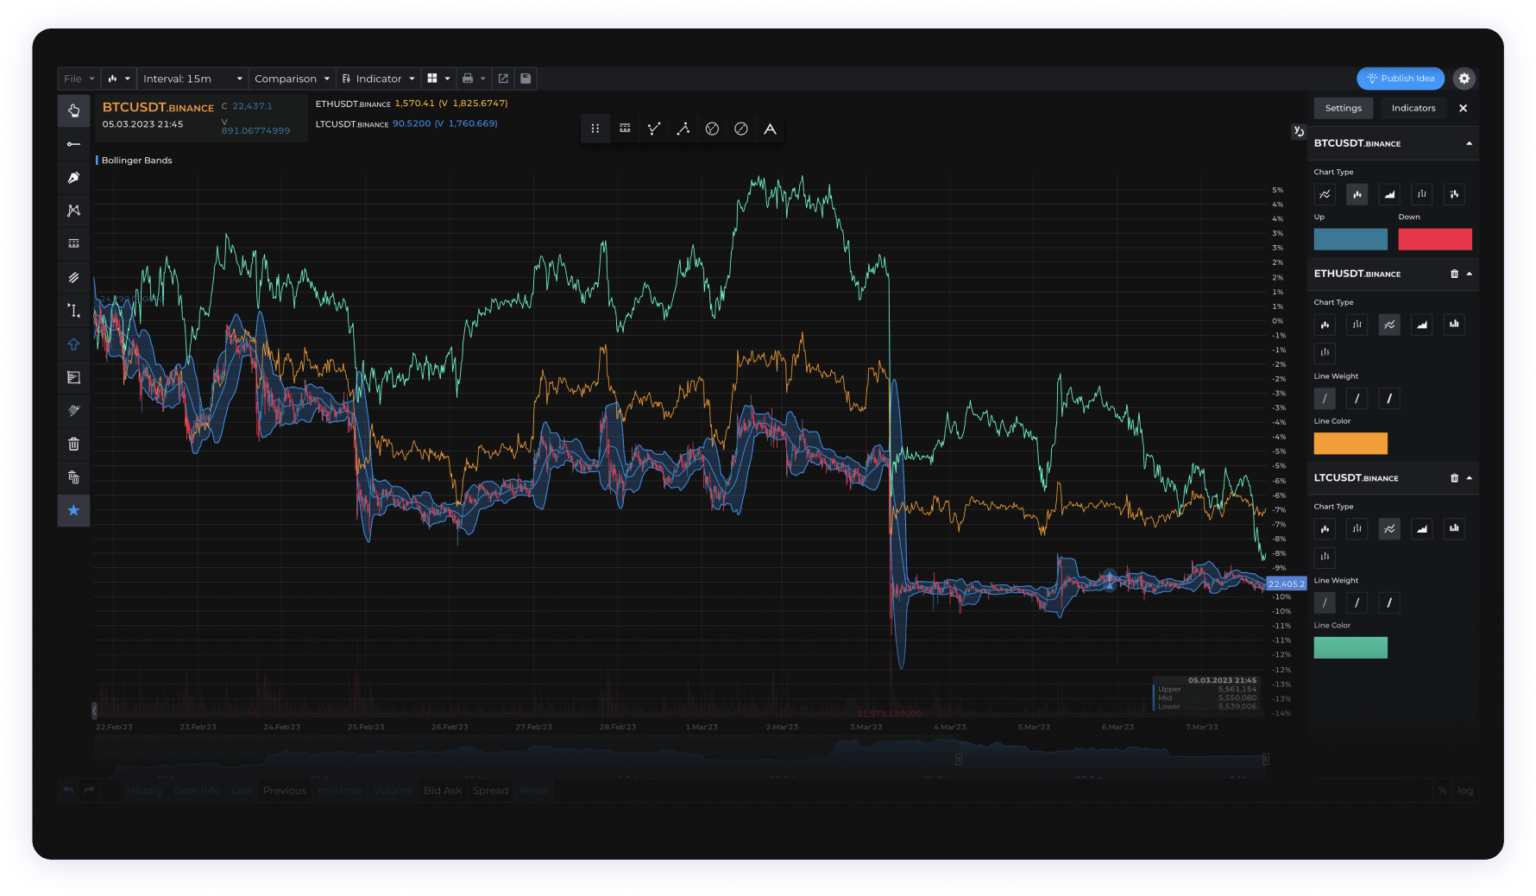
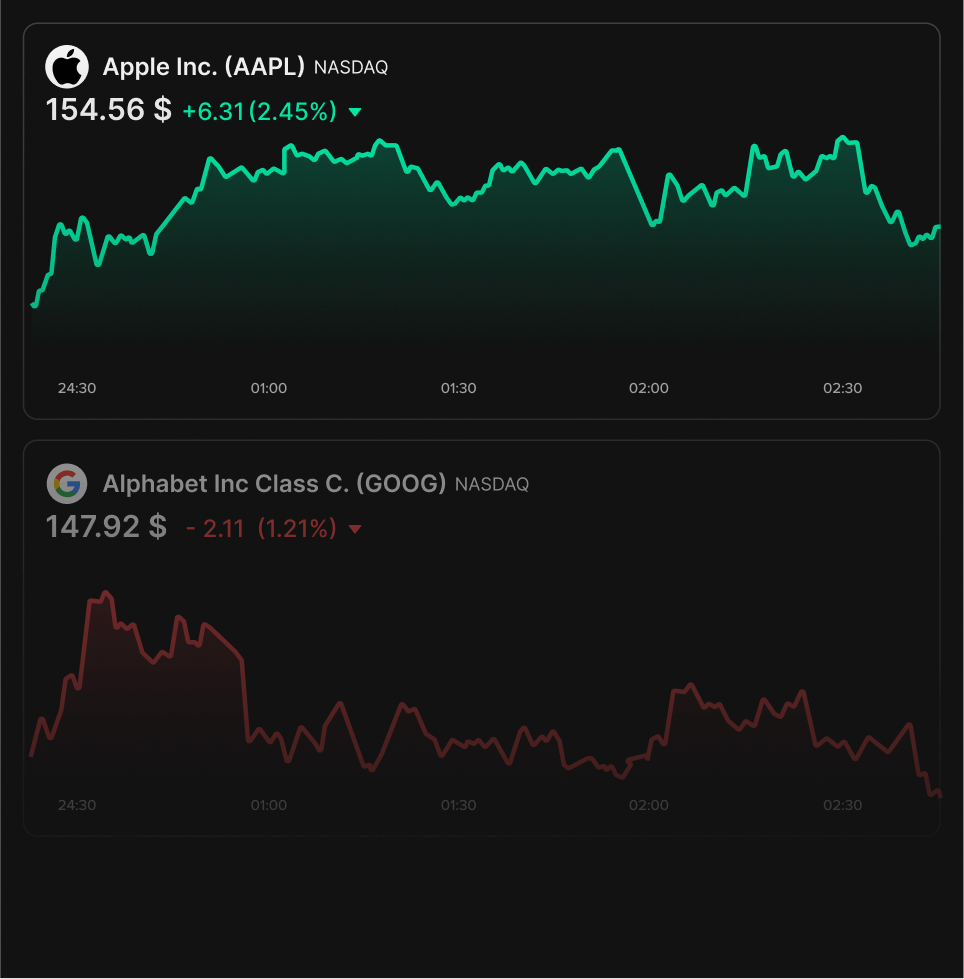
Xinfinit

Robust Financial Charts for any Platform

Modern Features, Seamless Integration

Charting Innovation, Simplified for You.

70+ Indicators

Unleash Analytical Power

20+ Drawing Tools

Unleash Analytical Power

One-Day Integration

Set up with Speed; No Hassle

Startup-Friendly

Grow Your Business with the Right Tools

Fast Market Entry

Launch Swiftly, Stay Ahead

Lightning Speed

Peak Performance for Peak Decisions

Custom Branding

Your Style, Our Tech

Expert Fintech Consulting

Our Knowledge, Your Edge

Chart Solutions Overview

Advanced Chart

Here’s a free and powerful chart for you to easily embed onto any website.
Make it yours with a ton of different customization options.

Basic Chart

Discover the simplicity of our Basic Chart, ideal for clear data visualization
and designed for ease of use.

Symbol Overview Chart

This compact chart provides a clear view of a
symbol’s price movements.

Drawing Tools
Drawing Tools

Employ over 40 recognized drawing tools for meticulous technical analysis, enabling you to illustrate every notable price pattern.

Robust Indicator Library

Explore financial instruments with an extensive selection of indicators. Forecast upcoming trends with our expansive indicator library, which also offers the flexibility to craft tailored chart analysis.

Instrument Analysis
Instrument Analysis

Conduct thorough market analysis with the ability to compare multiple instruments within the same chart.

Variety of Chart Options

Utilize a selection of the most widely-used chart types to better interpret market data.

Integrated Order Management

Interact with orders and positions effortlessly through our charts.

Customizable Chart Visualization Tools

Craft your charts precisely according to your preferences using intuitive settings. These allow you to modify the colors of candles and drawing tools, offering an expanded range of personalization options for analyzing and viewing your data.

previous arrowprevious arrow
next arrownext arrow
Clean and Intuitive Design

Our Basic Chart features a clean design with an intuitive interface, making it easy for users to track the performance of financial instruments with daily intervals for precise time analysis.

Enhance Analysis with Default Indicators

Unlock deeper insights by effortlessly adding indicators like Moving Averages, MACD, or Bollinger Bands to your Basic Chart. Customize easily for a tailored analytical experience.

Compare with Symbols

Put performance into perspective by adding default comparison symbols. Users can compare instruments with other financial benchmarks, offering a comprehensive market view.

previous arrowprevious arrow
next arrownext arrow
Comprehensive Symbol Overview

Our Symbol Overview Chart offers a panoramic view of any instrument, providing a comparative snapshot ideal for identifying trends and correlations.

Detailed Legend for quick overview

Effortlessly understand price-related data through our Detailed Legend. Users can easily view and interpret pricing fluctuations, volume changes, and more with just a quick look at the legend section.

Flexible Settings for a Custom Fit

Tailor the Symbol Overview Chart to your specifications. Adjust the default symbol, interval, width, height, and more with simple dropdown menus for a personalized display.

previous arrowprevious arrow
next arrownext arrow

Why Our Chart Solutions

Real Time Charts
Real-time data ensures you're trading on the most current market information available
Customizable Look and Feel
Give your chart a modern look with your own themes with ease.
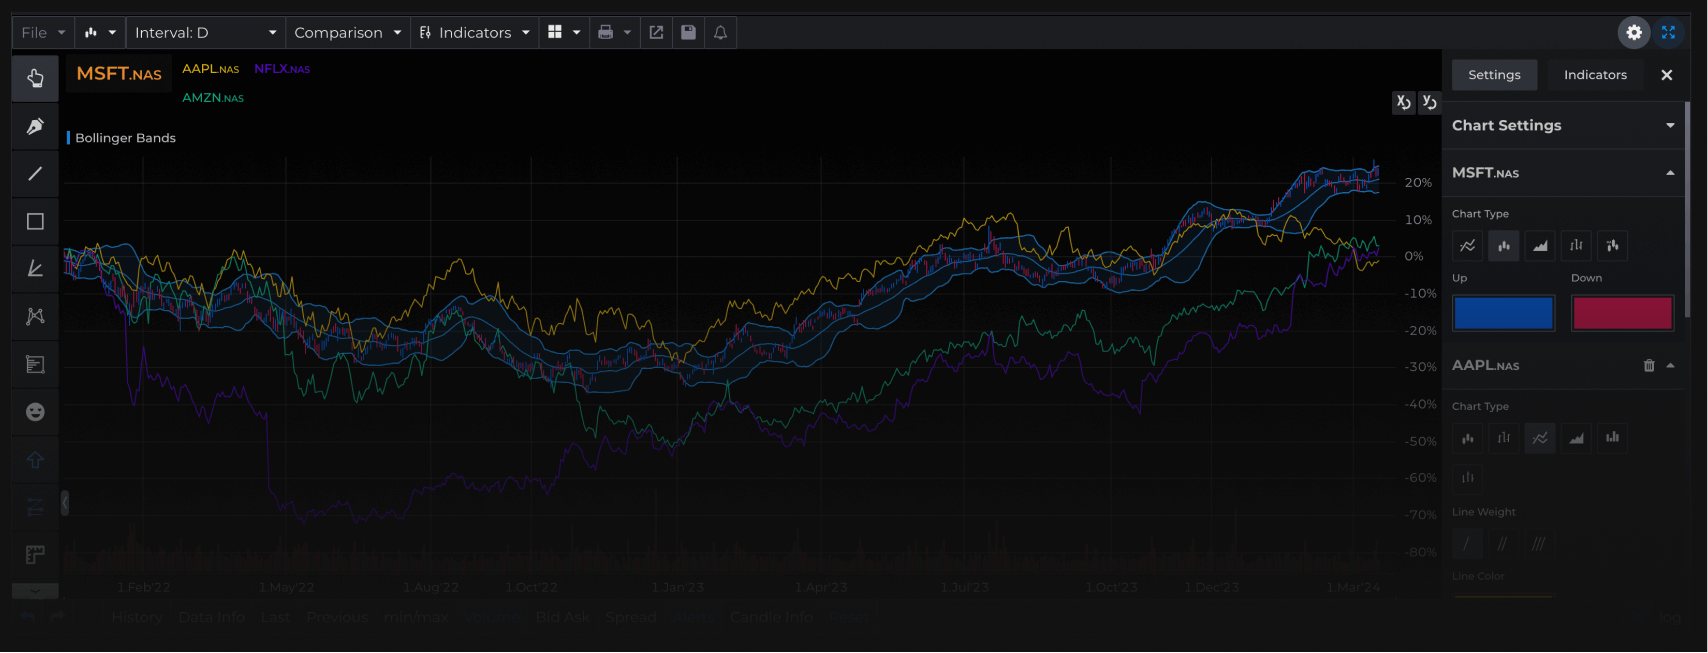
Multiple Integration Options
Our platform offers a variety of integration options, including a comprehensive chart library, embedded charts, and mobile webview charts
Integrate Various Data Sources
Easily integrate various data sources with our flexible platform, allowing for the seamless connection and visualization of different data streams.
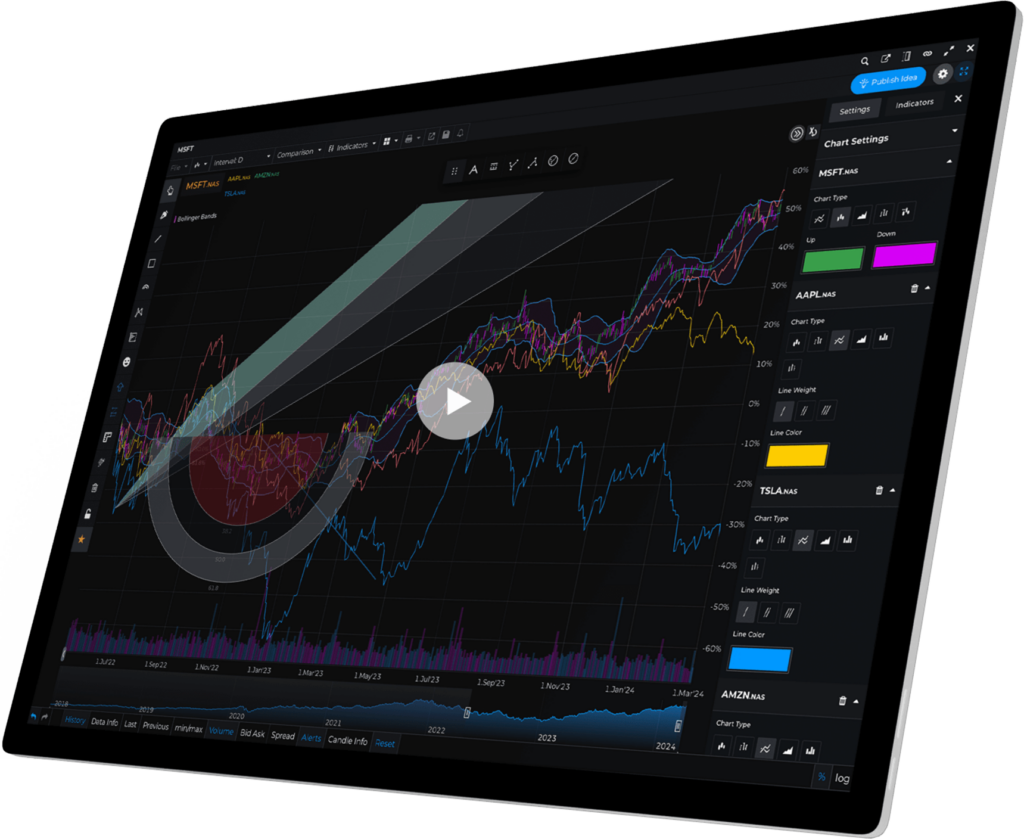
Adaptive Design
XINFINIT Charts are designed to adapt to any device, ensuring a seamless user experience across desktop, tablet, and mobile interfaces.
Customize Features
Xinfinit proudly offers personalized solutions tailored to our clients' unique needs. Request custom features, drawing tools, or indicators, and we will deliver these bespoke enhancements promptly
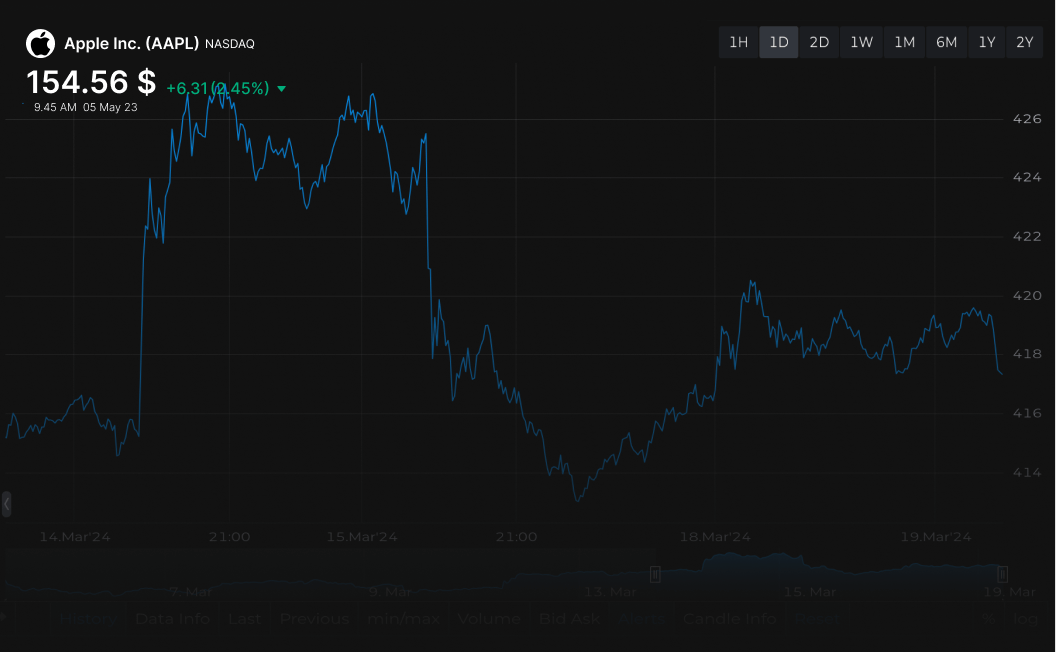
Ultra-Lightweight
Engineered for efficiency, our mini chart ensures a fast load time and smooth performance, keeping your website agile
Expert Developer Support
Beyond robust documentation and support, our expert developers are at your service to ensure seamless chart integration.
Quick and Easy Setup
Get your charts up and running in no time with our straightforward embedding process, no heavy lifting required

Overview of Chart Integration Options

Explore our comprehensive suite of chart solutions, designed to provide clear, actionable insights for informed decision-making in financial markets.

Preferred by Global Fintech Leaders